
Forget the “Sell in May” bedtime story. 7.1% in 90 days — that is what the average FIFA World Cup sponsor’s stock returned across the last four tournaments, measured from 30 days before kick-off to three months after the final. The S&P 500 managed 1.9% over the same windows. The FTSE 100 fell 1.1%. IG’s research lands at an awkward time for index believers and a useful one for stock pickers eyeing the 2026 tournament.
The numbers across four tournaments
The headline measurement window matters as much as the numbers themselves. IG looked at major sponsor performance from 30 days before each tournament’s first match to three months after the final, across the last four World Cup editions. That captures the full marketing build-up cycle, the tournament itself, and the post-event consumer halo.
Inside that window, sponsor stocks averaged a 7.1% return. The S&P 500 over the identical periods averaged 1.9%. The FTSE 100 actually lost ground, declining 1.1% on average across the same four windows. The gap is large enough that it survives the mid-2010s soft patches in UK equities — the FTSE’s negative print is driven specifically by the 2014 and 2018 tournament windows, both of which sat inside choppier macro phases.
Three different stock-market regimes, four tournaments, one consistent direction of travel. That is what makes this worth taking seriously rather than dismissing as cherry-picking.

Which brands carried the average
The interesting outlier is Adidas, which managed only 1.6% — well below the basket average and in the same general zone as the S&P 500.
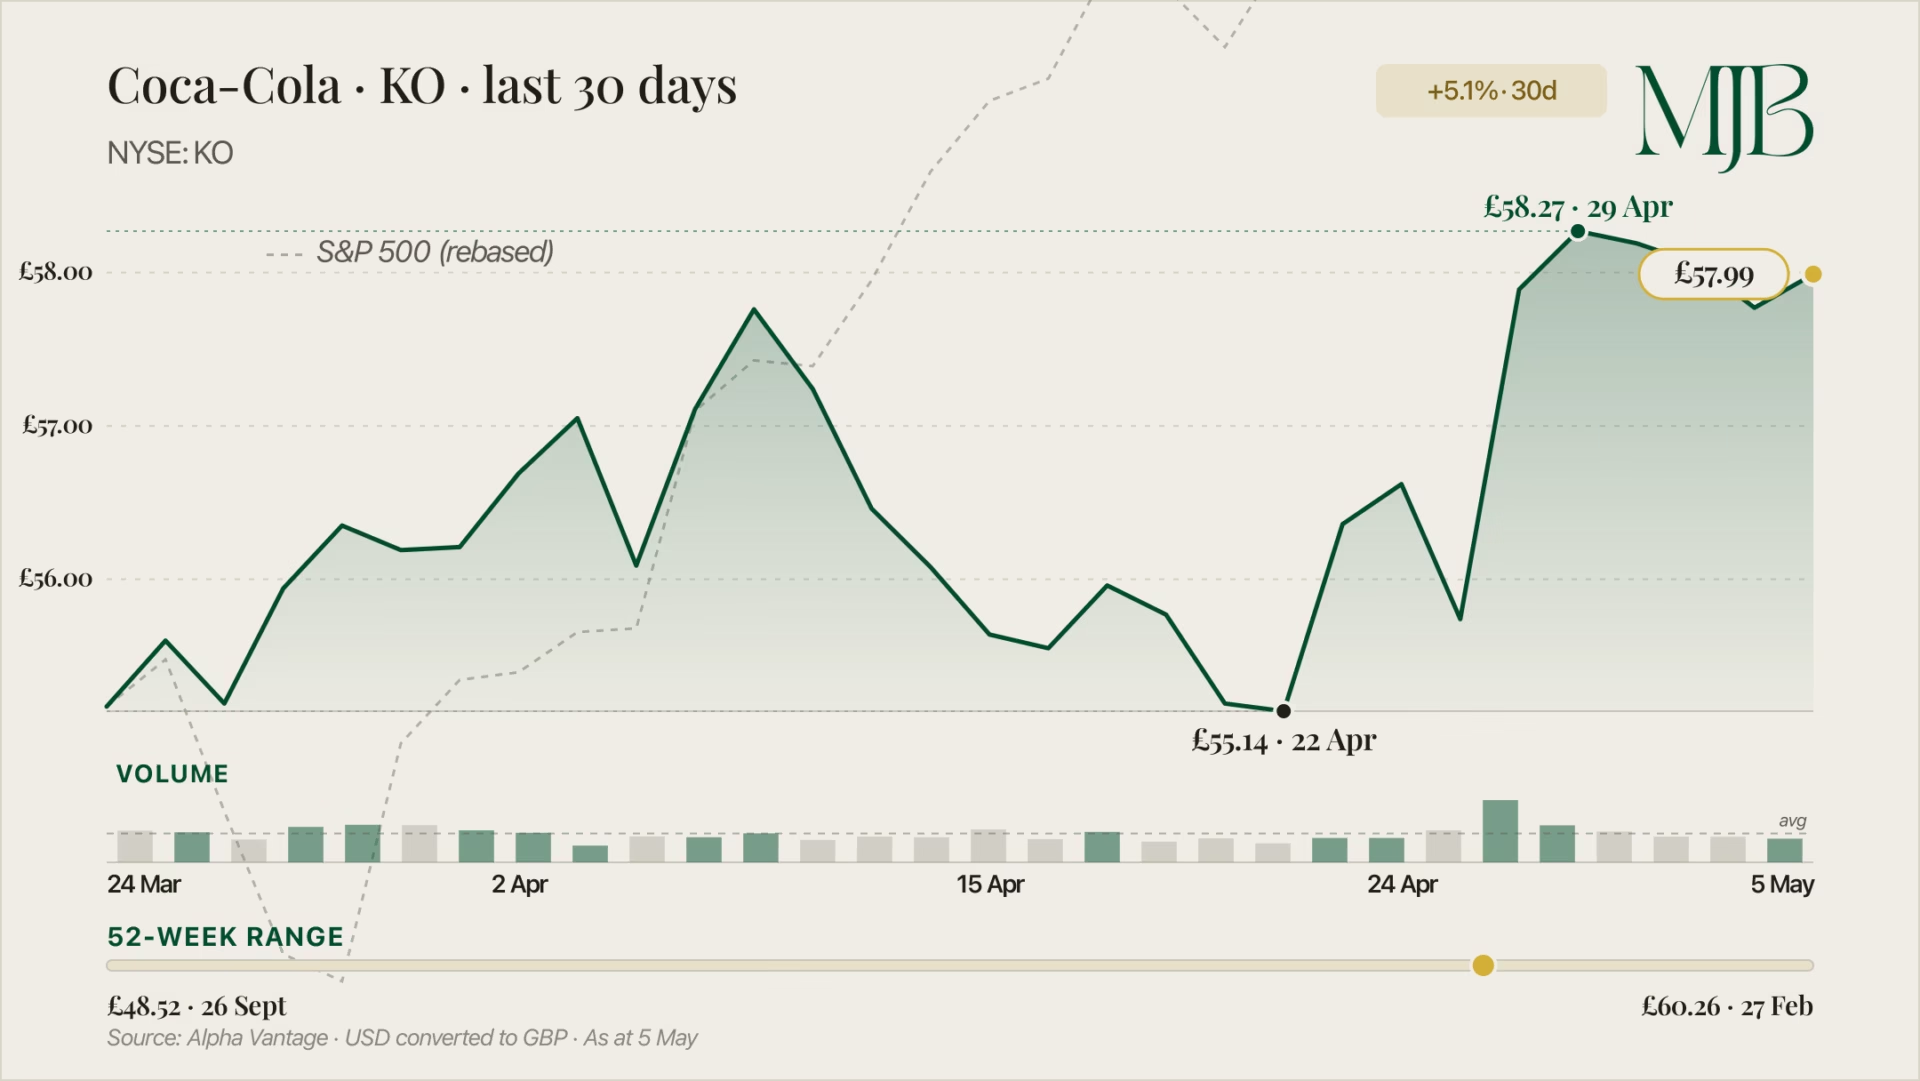
The 7.1% headline hides a wider distribution. Apparel and consumer staples did the heavy lifting. Nike returned 17.7% across the windows — comfortably the strongest performer in the basket. Kia followed at 12%. Coca-Cola (NYSE: KO) printed 8.6% and AB InBev 7.9%, both clear of the basket average.
The interesting outlier is Adidas, which managed only 1.6% — well below the basket average and in the same general zone as the S&P 500. Two apparel-sector sponsors, two very different outcomes. That spread alone tells you the “World Cup sponsor effect” isn’t a free lunch — it depends on which sponsor, which tournament window, and what the rest of the brand’s business is doing alongside the sport-marketing push.
What does carry across the basket is the structural tailwind. Sponsorship rights pull marketing spend forward into the tournament window, consumer attention concentrates on a small set of recognisable brands, and that visibility shows up in near-term sales — which shows up in near-term share-price drift.
Why the pattern actually works
Chris Beauchamp, chief market analyst at IG, said: “The World Cup creates a unique environment where a small group of globally recognised brands capture a disproportionate share of attention and that visibility can feed through into stronger stock performance over a relatively short period.”
The seasonal angle is the part traders should care about. Beauchamp added: “It’s particularly interesting when you set that against the traditional ‘Sell in May’ narrative, where markets are often expected to drift or soften over the summer months.” World Cup sponsorship is one of the few thematic plays that runs directly counter to summer index seasonality. The marketing-spend cadence simply doesn’t align with the broader equity calendar.
That gives the pattern a structural rather than coincidental flavour — at least in the four windows IG measured. Whether the structural argument holds when the global macro overlay turns hostile is the question 2026 is about to answer.

The 2026 caveat
This year’s tournament hits in the middle of an Iran-related oil-supply disruption that is reshaping every global equity calculation. Beauchamp flagged the risk directly — World Cup sponsor returns “could also see figures impacted” by the war-driven backdrop.
That matters because the historic 7.1% sponsor average was measured under broadly normal macro conditions. 2026 is not a normal cycle. Energy-cost inflation, supply-chain stress, and risk-off positioning could blunt the consumer-spending tailwind that sponsorship returns rely on.
The stock-picker question is which sponsors are most insulated. Nike, Adidas and the apparel category face direct exposure to consumer discretionary spend — the most vulnerable line if real incomes get squeezed further.
Coca-Cola and AB InBev sell into staples categories that hold up better in downturns. Kia, as an auto play, sits in the middle. The 2026 cycle is the test of whether the historic 7.1% holds across all sponsors, or whether the basket bifurcates by sector.

The Bottom Line
For four tournaments running, sponsor stocks have beaten the indexes by a wide enough margin to make the pattern worth watching. 2026 is the first cycle where Iran-driven macro risk sits directly on top of the tournament window. If you watch this summer with a stock screen open, the sponsors that hold the pattern under stress are your 2030 watchlist. The rest will be noise.
Want more like this? Sign up to The MJBurrows Briefing — our free weekly newsletter delivered every Monday morning.
FAQ
What return have FIFA World Cup sponsors averaged historically?
IG’s research found major sponsor stocks averaged a 7.1% return across the last four World Cup cycles — measured from 30 days before each tournament’s opening match to three months after the final. The S&P 500 averaged 1.9% over the same windows; the FTSE 100 declined 1.1%.
Why do sponsor stocks outperform during World Cups?
The structural driver is concentrated attention. A small set of globally recognised brands captures disproportionate share of consumer focus during the tournament, marketing spend pulls forward into the window, and that visibility flows through to near-term sales and share-price drift — particularly meaningful when summer index seasonality is otherwise weak.
Could 2026 break the pattern?
Yes, and IG itself flagged it. This year’s tournament sits inside an Iran-related oil-supply disruption that could blunt the consumer-spending tailwind sponsorship returns rely on, particularly for apparel-sector sponsors most exposed to discretionary spend.


Disclosure & Editorial Standards
MJBurrows is not authorised or regulated by the Financial Conduct Authority (FCA). The content on this website — including articles, calculators, and tools — is for general informational and educational purposes only. It does not constitute personal financial, investment, tax, or legal advice and does not take into account your individual circumstances, financial situation, or objectives.
Nothing on this site is a personal recommendation to buy, sell, hold, or otherwise deal in any financial product, asset, or service. You should always conduct your own research and seek advice from a qualified, FCA-regulated financial adviser before making any financial decisions.
Our calculators produce estimates based on simplified models using HMRC-published rates for the current tax year. They cannot account for every individual circumstance and should not be relied upon as exact figures. Tax rules and rates may change — verify current rates with HMRC or a qualified tax adviser.
Projections are not guarantees. Where our tools show future values (investment growth, pension projections, compound interest), these are hypothetical illustrations based on assumed growth rates. Past performance does not guarantee future results. The value of investments can go down as well as up.
Market data displayed on this site is provided by third-party sources including Twelve Data, Yahoo Finance, and CoinGecko. We do not guarantee the accuracy, completeness, or timeliness of third-party data.
This content is designed for UK residents and reflects UK tax rules, thresholds, and legislation. It may not apply to other jurisdictions.
Using this website does not create a professional-client relationship of any kind. MJBurrows is not responsible for any financial loss, damage, or decision made based on the content presented. By using this site, you accept these terms.
This disclaimer may be updated from time to time without prior notice. Last reviewed: 23 April 2026.
MJBurrows is an independent UK personal finance publication, written and edited by Matthew Burrows. There is no parent company, no investor group, and no advertising sales team — decisions about what to cover and how to frame it are made by Matthew alone. Our full Editorial Policy sets out how the site operates in detail.
Commercial model. As of April 2026, MJBurrows generates no revenue. The site carries no display advertising, no affiliate links, no sponsored content, no paid product placements, and no pay-for-coverage arrangements. If this changes in future, it will be disclosed openly on the Editorial Policy page.
Sources. Articles and tools reference primary sources — HM Revenue & Customs (HMRC), gov.uk, the Bank of England, the Office for National Statistics (ONS), the Financial Conduct Authority (FCA), Companies House, and UK government departmental publications (DWP, Treasury). Calculator data uses HMRC-published rates for the 2026/27 tax year. Market data (tickers, asset prices) is provided by Twelve Data, Yahoo Finance, and CoinGecko.
Verification. Every published article is fact-checked before going live. Numerical claims are traced to their primary source, quotes are checked against the original speaker or document, and calculator outputs are tested against HMRC worked examples. See our verification and accuracy policy for the full process.
Corrections. If you spot an error, please report it via the Corrections page. A three-tier severity system commits to specific response times:
- Tier 1 — Urgent (material reader harm, defamatory statements, regulatory or legal issues): acknowledged within 24 hours, page actioned within 24 hours, correction published within 48 hours of confirmation.
- Tier 2 — High (significant factual errors that misinform readers): acknowledged within 3 working days, correction published within 7 working days of confirmation.
- Tier 3 — Standard (minor factual errors, dated references, missing context): acknowledged within 7 working days, correction published at the next regular content review (within the quarter).
Significant corrections are logged on the public Corrections log.
Updates and review cadence. Calculators are reviewed at least quarterly, plus event-driven updates when HMRC publishes new rates (Budget, Autumn Statement, new tax year). Guides are reviewed at least twice a year, with major rewrites whenever underlying regulation changes. Tax-year-sensitive content is prioritised for review at the April tax-year transition.
Get in touch. For editorial enquiries — corrections, story tips, reader questions — the address is contact@mjburrows.com. The contact page is at mjburrows.com/contact. Every email is read personally by Matthew.