
Forget the comfort-blanket framing. Last year the FTSE 100 ran 21.5% — its best calendar year since 2009. Behind that headline, the win was narrow, and one of the loudest beneficiaries was the unglamorous utilities sector. National Grid up 20.7%. United Utilities up 30.9%. The smart money is now asking whether the trade still works — or whether the bond yield surge is about to set a trap.
The 2025 numbers behind utilities’ run
The FTSE 100‘s 21.5% calendar year was the best print since 2009, but the gains came from a narrow band: financials, defence, energy and utilities did the bulk of the lifting. The utilities slice landed because investors rotated into defensive cash flows as Iran war risk pushed oil higher and macro visibility shrank.
Russ Mould, investment director at AJ Bell, said: “Investors have sought out a bit of defensive stodge — businesses that are relatively insensitive to the economy. That near-term backdrop to a degree favours utilities.”
The result on the tape: National Grid up 20.7% over the last year. United Utilities, the water-services player, up 30.9%. Defensive in name, growth-stock returns in fact — which is exactly the setup that should make a careful investor ask whether the trade has any room left.
The bull case investors keep buying
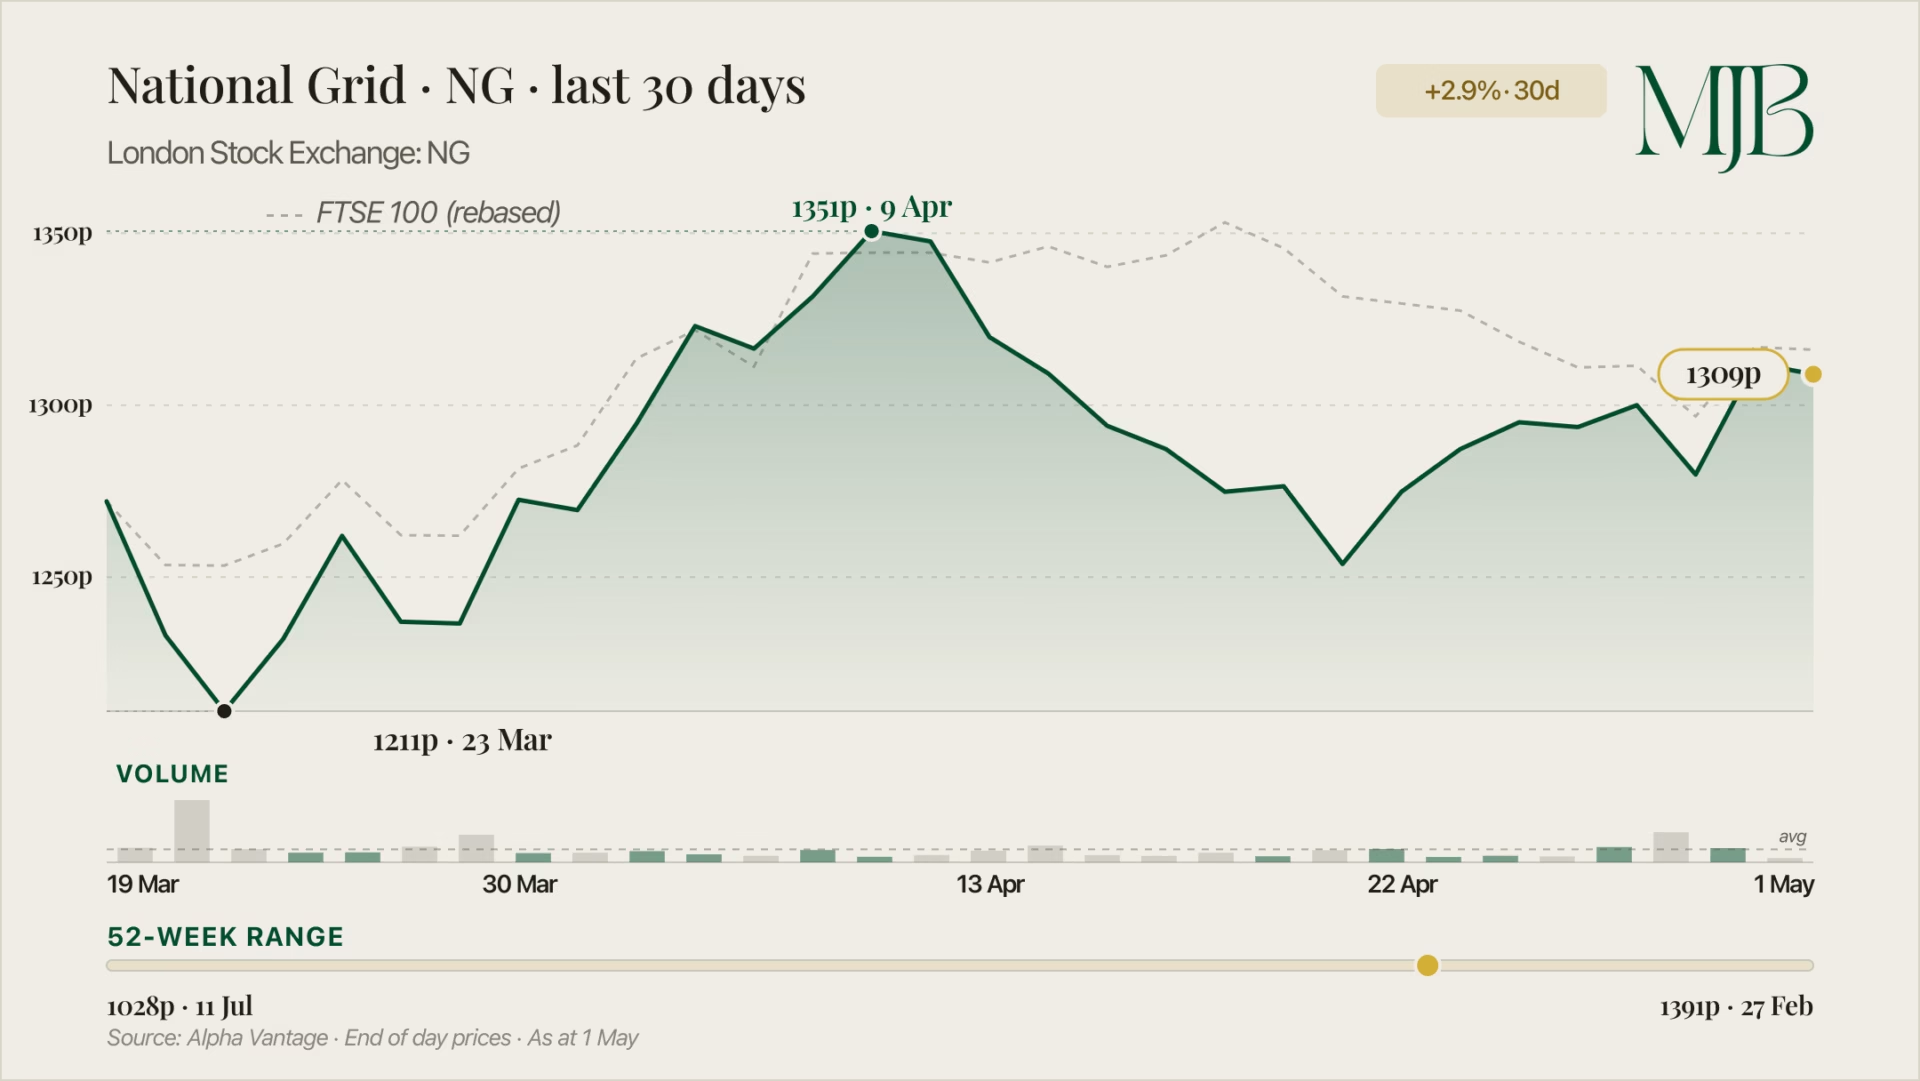
National Grid has confirmed a £70bn capital investment programme over the next five years, with the bulk going to electricity assets.
The operational case is straightforward. National Grid trades on a price-to-earnings ratio of 21, in line with the FTSE 100’s earnings multiple. The company is forecast to post a 14% rise in EPS this financial year, with a recently revised plan targeting between 8 and 10 per cent annualised EPS growth through to 2031. Analysts expect that to outpace the wider index.
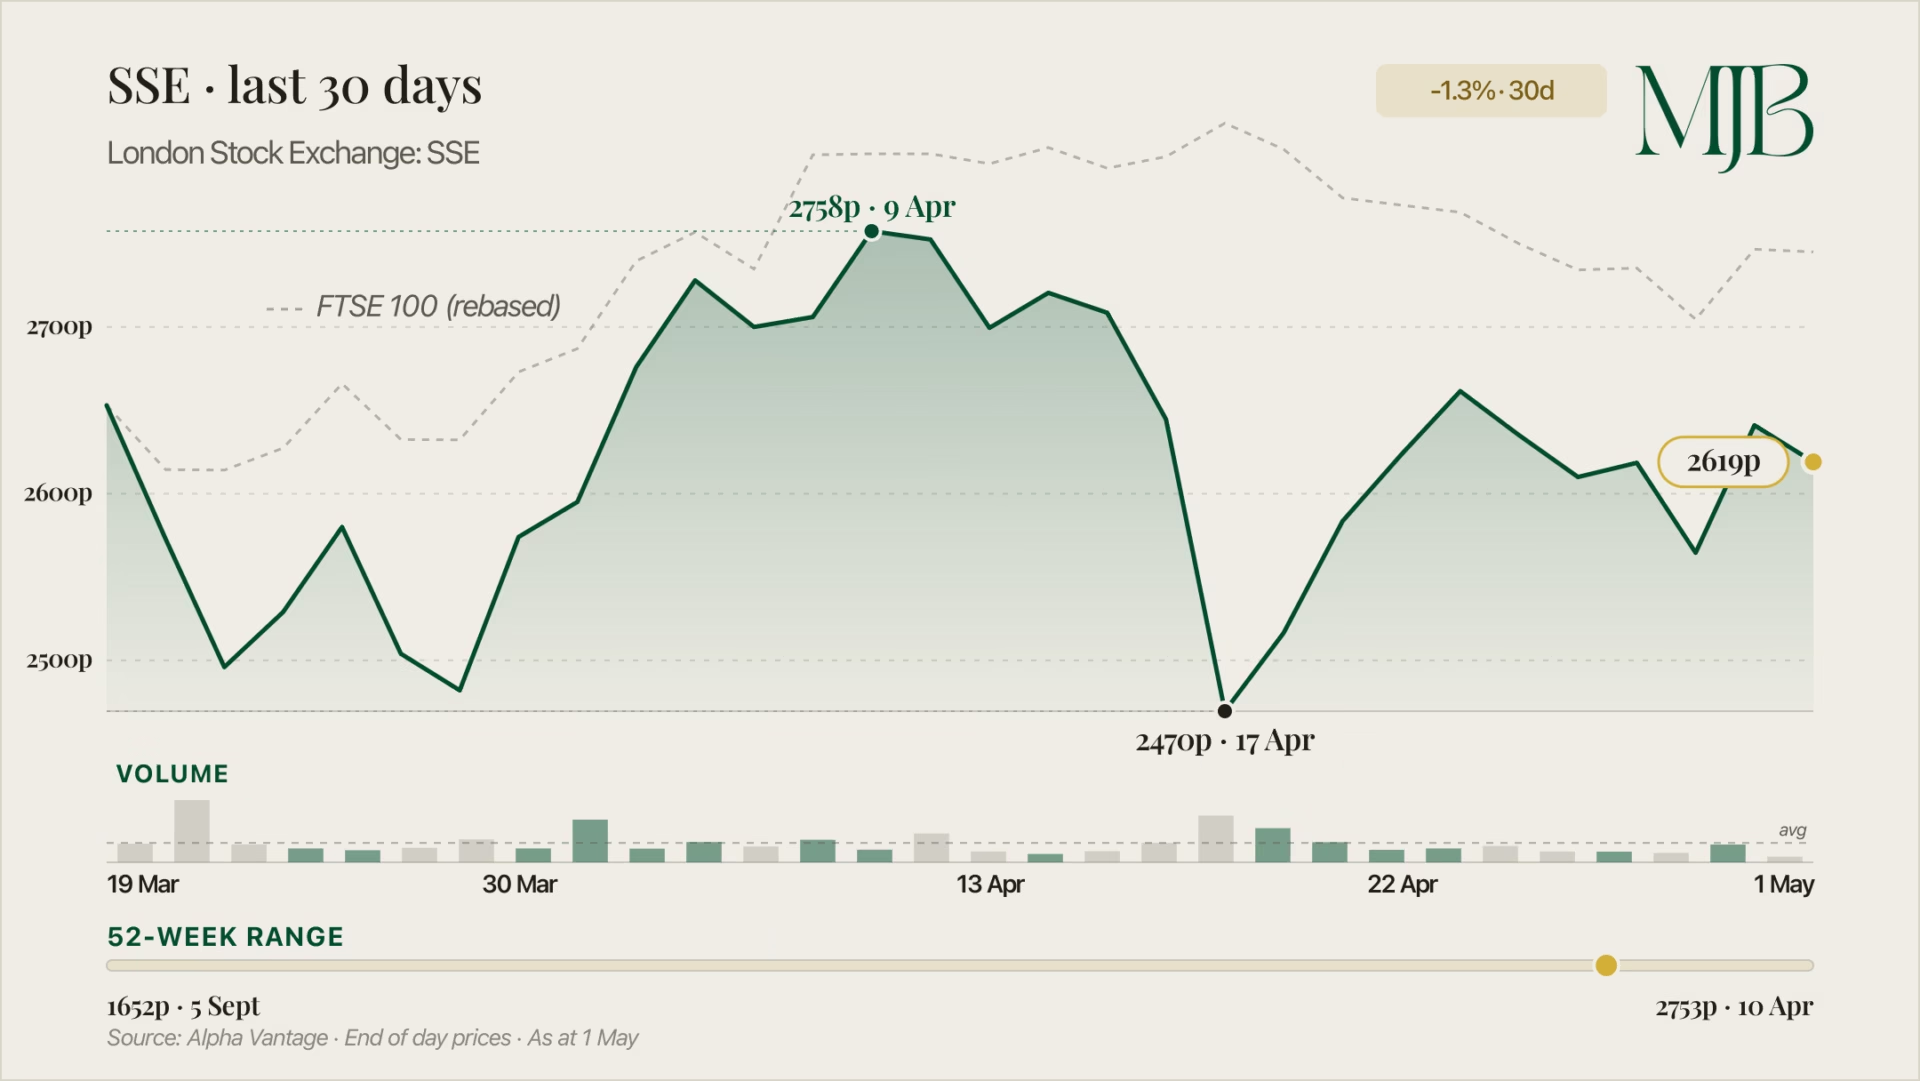
Peers compound the picture. SSE is expected to print underlying EPS in the top half of its 147p-152p range. United Utilities reported a 42% gain in EPS to 107.1p in its latest trading update. None of these are fireworks — they are the kind of compound numbers that fund a steady, rising dividend.
The capital plans behind the EPS line are larger still. National Grid has confirmed a £70bn capital investment programme over the next five years, with the bulk going to electricity assets. Roughly 80% of SSE’s £33bn long-term investment plan is earmarked for regulated electricity networks. Mould’s framing on the data-centre tailwind landed sharp: “Data centres suck up vast amounts of energy, so utilities are therefore seen as potential beneficiaries.”

The bond proxy trap
This is where the trade gets more nuanced. Utility stocks are widely held as bond proxies — investors buy them for the dividend yield, much as they would buy a long-dated gilt.
The mechanic that follows is unforgiving: when bond yields rise, utility share prices have to fall until their dividend yields look attractive again next to the new risk-free rate. UK bond yields recently hit their highest level since 2008, which loads the spring under the trap.
Mould was direct: “Increased bond yields can lessen the relative attraction of equities compared to fixed income as a source of yield. For shares, it means paying a lower valuation and perhaps demanding a higher dividend yield.”
That is a clean way of saying: the utility you bought for steady income may need to drop in price for the yield to keep working as a real-money offer. National Grid’s strategy of growing its dividend in line with inflation gets harder to defend the longer gilts trade where they are now.
Windfall tax and the debt overhang
The third piece of the bear case lands on 1 July. The energy profits levy — the windfall tax — climbs from 45% to 55% and the regime now extends beyond 2028.
SSE is the most direct casualty in the sector: its wind-farm profits will be caught by the higher rate. Mould flagged the knock-on bluntly — companies that need capital to fund rising taxes have less to fund investment plans, which thins the EPS-growth story everyone is buying.
National Grid carries its own structural overhang. The group’s debt pile sits at £38.4bn, which makes its valuation more rate-sensitive than most FTSE 100 peers. The defence is geographic: a large share of National Grid’s profit comes from US assets, hedging against UK regulatory shifts. SSE has no such hedge.
The geographic split is more than a tax shield. It is a corporate-strategy diversification that no other large UK utility shares. SSE, Centrica and United Utilities all run UK-domestic earnings, which makes them more directly exposed to the windfall regime and to UK rate moves. That asymmetry is part of why analysts often draw a quality gap between National Grid and the sector’s UK-only names — a quality gap that gets sharper the longer gilt yields stay where they are.

The Bottom Line
Utilities are the FTSE’s defensive comfort blanket of 2026 — and on operational metrics, they earn the label. But the bond proxy mechanic and a 10-point windfall-tax hike on 1 July are conspiring to make defensive look harder this year. Investors who pile in for the dividend yield need to watch for the moment that yield gets repriced higher. By autumn, this trade looks different.
Want more like this? Sign up to The MJBurrows Briefing — our free weekly newsletter delivered every Monday morning.
FAQ
What makes utility stocks defensive?
Utilities sell electricity, gas and water — services with broadly inelastic demand even in downturns — and many UK utilities operate under regulated revenue frameworks. That combination delivers steady cash flows and predictable dividends, which is what investors seek when macro visibility is poor.
How does the windfall tax change on 1 July 2026 affect utility stocks?
The energy profits levy rises from 45% to 55% from 1 July and now extends beyond 2028, meaning more profit gets taxed for longer. SSE is most exposed because its wind-farm earnings sit inside the levy’s net, while National Grid is partly insulated by US-derived profit that sits outside the UK regime.
What is a bond proxy and why does it matter for utilities?
A bond proxy is an equity that investors buy primarily for its dividend yield, treating it like a high-yielding fixed-income holding. When bond yields rise, the equity has to drop in price for its dividend yield to stay competitive — which is why utilities are vulnerable when gilts trade at multi-year highs.


Disclosure & Editorial Standards
MJBurrows is not authorised or regulated by the Financial Conduct Authority (FCA). The content on this website — including articles, calculators, and tools — is for general informational and educational purposes only. It does not constitute personal financial, investment, tax, or legal advice and does not take into account your individual circumstances, financial situation, or objectives.
Nothing on this site is a personal recommendation to buy, sell, hold, or otherwise deal in any financial product, asset, or service. You should always conduct your own research and seek advice from a qualified, FCA-regulated financial adviser before making any financial decisions.
Our calculators produce estimates based on simplified models using HMRC-published rates for the current tax year. They cannot account for every individual circumstance and should not be relied upon as exact figures. Tax rules and rates may change — verify current rates with HMRC or a qualified tax adviser.
Projections are not guarantees. Where our tools show future values (investment growth, pension projections, compound interest), these are hypothetical illustrations based on assumed growth rates. Past performance does not guarantee future results. The value of investments can go down as well as up.
Market data displayed on this site is provided by third-party sources including Twelve Data, Yahoo Finance, and CoinGecko. We do not guarantee the accuracy, completeness, or timeliness of third-party data.
This content is designed for UK residents and reflects UK tax rules, thresholds, and legislation. It may not apply to other jurisdictions.
Using this website does not create a professional-client relationship of any kind. MJBurrows is not responsible for any financial loss, damage, or decision made based on the content presented. By using this site, you accept these terms.
This disclaimer may be updated from time to time without prior notice. Last reviewed: 23 April 2026.
MJBurrows is an independent UK personal finance publication, written and edited by Matthew Burrows. There is no parent company, no investor group, and no advertising sales team — decisions about what to cover and how to frame it are made by Matthew alone. Our full Editorial Policy sets out how the site operates in detail.
Commercial model. As of April 2026, MJBurrows generates no revenue. The site carries no display advertising, no affiliate links, no sponsored content, no paid product placements, and no pay-for-coverage arrangements. If this changes in future, it will be disclosed openly on the Editorial Policy page.
Sources. Articles and tools reference primary sources — HM Revenue & Customs (HMRC), gov.uk, the Bank of England, the Office for National Statistics (ONS), the Financial Conduct Authority (FCA), Companies House, and UK government departmental publications (DWP, Treasury). Calculator data uses HMRC-published rates for the 2026/27 tax year. Market data (tickers, asset prices) is provided by Twelve Data, Yahoo Finance, and CoinGecko.
Verification. Every published article is fact-checked before going live. Numerical claims are traced to their primary source, quotes are checked against the original speaker or document, and calculator outputs are tested against HMRC worked examples. See our verification and accuracy policy for the full process.
Corrections. If you spot an error, please report it via the Corrections page. A three-tier severity system commits to specific response times:
- Tier 1 — Urgent (material reader harm, defamatory statements, regulatory or legal issues): acknowledged within 24 hours, page actioned within 24 hours, correction published within 48 hours of confirmation.
- Tier 2 — High (significant factual errors that misinform readers): acknowledged within 3 working days, correction published within 7 working days of confirmation.
- Tier 3 — Standard (minor factual errors, dated references, missing context): acknowledged within 7 working days, correction published at the next regular content review (within the quarter).
Significant corrections are logged on the public Corrections log.
Updates and review cadence. Calculators are reviewed at least quarterly, plus event-driven updates when HMRC publishes new rates (Budget, Autumn Statement, new tax year). Guides are reviewed at least twice a year, with major rewrites whenever underlying regulation changes. Tax-year-sensitive content is prioritised for review at the April tax-year transition.
Get in touch. For editorial enquiries — corrections, story tips, reader questions — the address is contact@mjburrows.com. The contact page is at mjburrows.com/contact. Every email is read personally by Matthew.