
Introduction
London’s poshest postcodes just had their worst month since the financial crisis. Inner London house prices crashed 4.6% year-on-year in November—the steepest fall since 2008—as Budget speculation and affordability pressures sent the market into a tailspin. Kensington, Chelsea, and Westminster led the plunge, with some areas down over 15%. But here’s the twist: outer London’s still climbing. Let’s break down what’s actually happening in the capital’s property market.
The Mansion Tax Panic That Crushed Demand
Budget rumours hit London’s luxury market like a wrecking ball.
In the weeks before Chancellor Rachel Reeves’ Autumn Budget, whispers about property tax hikes sent wealthy buyers into hiding. The result? Kensington and Chelsea prices dropped 16.3% to an average of £1.19m, whilst Westminster fell 15.5% to £866,000.
What Actually Happened at the Budget
Reeves introduced a “mansion tax” surcharge for homes over £2m, kicking in from April 2028. The charge rises from £2,500 for properties valued between £2m and £2.5m up to £7,500 for homes above £5m, with four price bands in total.
The measure’s expected to raise £400m by 2029-30, flowing straight to central government rather than local councils.
But the real damage came from rumours that never materialised. Speculation about stamp duty shake-ups and capital gains tax on primary residences created a “wait and see” paralysis across high-end buyers.
Colleen Babcock from Rightmove summed it up: “November was an uncertain period for the market, as many home-movers had an eye on what the Budget might contain and how it might affect their personal situation.”

The Two Londons: Inner Crash vs Outer Boom
Whilst Kensington counted its losses, outer London boroughs were popping champagne.
Havering and Bromley both posted strong gains—5.2% and 6% respectively—as buyers stretched further from the centre chasing affordability. The split created a 1.2% overall drop across London, bringing the average to £553,000.
Why the Divide?
Jason Tabb from On The Market pointed to “increased supply, low buyer demand and stretched affordability” in inner boroughs. Higher living costs didn’t help either.
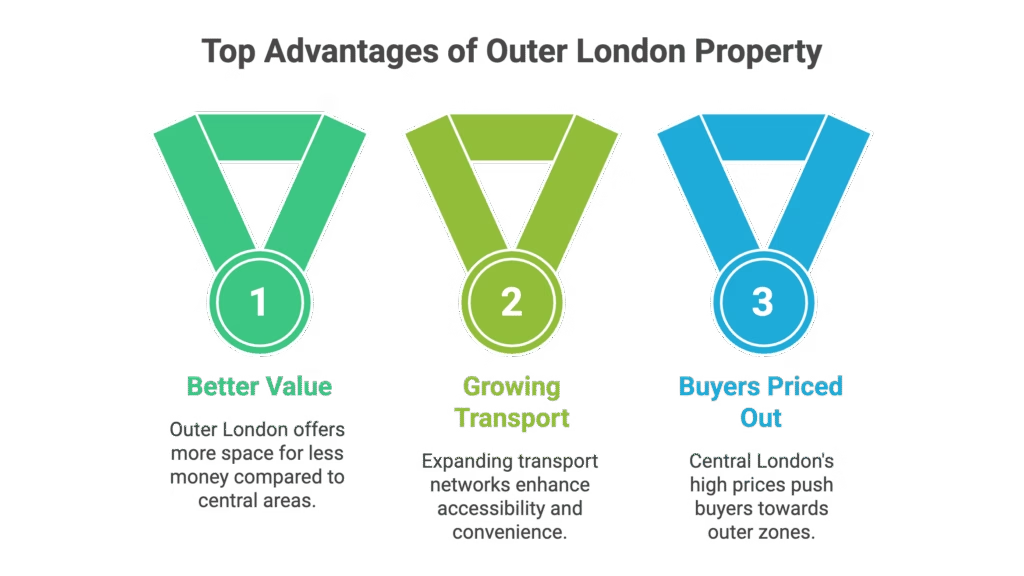
Meanwhile, outer London benefits from:
- Better value per square foot
- Growing transport links
- Buyers priced out of central zones
London’s still the UK’s priciest region, but the gap’s narrowing as affordability bites.
London’s Rental Crisis Gets Worse
Prices fell, but renters got hammered anyway.
Average London rent hit £2,268 per month in November—nearly triple the North East’s £762. The culprit? Landlords are ditching the market in droves, crushing supply.
Nathan Emerson from Propertymark explained: “The rental market continues to suffer from a chronic undersupply of properties versus actual demand. Many letting agents continue to highlight concerns regarding the impact of updated legislation and the real-world effect such changes are having on many landlords’ ability to operate.”
Complex tax frameworks and regulatory changes are pushing landlords to sell up, leaving renters fighting over scraps.
What’s Next for UK House Prices?
London might be struggling, but the rest of the UK’s doing fine.
Average UK house prices jumped 2.5% to £271,000 in November—the first acceleration since June. The North East led with a 6.8% surge, followed by the North West at 4.1%.
Will 2025 Bring Recovery?
Analysts reckon falling mortgage rates could revive the market, but there’s a catch.
Paige Tao from PwC UK said: “With the Budget proving less disruptive than feared, and the Bank of England cutting interest rates in December, confidence is starting to return, and we expect activity to further rebound in the New Year.”
Tom Bill from Knight Frank nailed the real issue: confidence “is the key missing ingredient” for buyers facing economic and political volatility.
Translation? If policymakers can provide clarity and rates keep dropping, 2025 could see London bounce back. But right now, buyers are sitting tight.

Conclusion
London’s luxury market just had its worst run since 2008, crushed by Budget panic and affordability pressures. Inner boroughs crashed whilst outer zones climbed, creating a capital divided. With the mansion tax confirmed and rental supply drying up, 2026’s looking tricky—but falling mortgage rates and clearer policy signals could turn things around.
FAQ
Q1: Why did London house prices fall so sharply in November?
A: Budget speculation about property tax hikes spooked high-end buyers, creating a “wait and see” freeze. Affordability constraints and higher living costs piled on the pressure, particularly in inner London’s priciest boroughs.
Q2: What is the mansion tax introduced in the Autumn Budget?
A: It’s an annual surcharge on homes worth over £2m, with four price bands ranging from £2,500 (for properties between £2m and £2.5m) to £7,500 (for homes above £5m). The tax kicks in from April 2028 and is expected to raise £400m for central government by 2029-30.
Q3: Why are London rental prices so high?
A: Landlords are selling up due to complex tax frameworks and updated legislation, drastically reducing rental supply. With demand staying strong and stock levels overstretched, rents have hit record levels averaging £2,268 per month.
Q4: Will UK house prices continue to rise in 2025?
A: Probably, if mortgage rates keep falling and confidence returns. The Bank of England’s December interest rate cut helped, but buyers need policy certainty before fully committing to the market again.
Q5: Which London areas saw the biggest house price drops?
A: Kensington and Chelsea led the fall with a 16.3% annual drop to £1.19m average, followed by Westminster at 15.5% down to £866,000. Outer boroughs like Havering and Bromley actually posted gains of 5.2% and 6% respectively.
DISCLAIMER
Effective Date: 15th July 2025
The information provided on this website is for informational and educational purposes only and reflects the personal opinions of the author(s). It is not intended as financial, investment, tax, or legal advice.
We are not certified financial advisers. None of the content on this website constitutes a recommendation to buy, sell, or hold any financial product, asset, or service. You should not rely on any information provided here to make financial decisions.
We strongly recommend that you:
- Conduct your own research and due diligence
- Consult with a qualified financial adviser or professional before making any investment or financial decisions
While we strive to ensure that all information is accurate and up to date, we make no guarantees about the completeness, reliability, or suitability of any content on this site.
By using this website, you acknowledge and agree that we are not responsible for any financial loss, damage, or decisions made based on the content presented.
MORE NEWS


Disclosure & Editorial Standards
MJBurrows is not authorised or regulated by the Financial Conduct Authority (FCA). The content on this website — including articles, calculators, and tools — is for general informational and educational purposes only. It does not constitute personal financial, investment, tax, or legal advice and does not take into account your individual circumstances, financial situation, or objectives.
Nothing on this site is a personal recommendation to buy, sell, hold, or otherwise deal in any financial product, asset, or service. You should always conduct your own research and seek advice from a qualified, FCA-regulated financial adviser before making any financial decisions.
Our calculators produce estimates based on simplified models using HMRC-published rates for the current tax year. They cannot account for every individual circumstance and should not be relied upon as exact figures. Tax rules and rates may change — verify current rates with HMRC or a qualified tax adviser.
Projections are not guarantees. Where our tools show future values (investment growth, pension projections, compound interest), these are hypothetical illustrations based on assumed growth rates. Past performance does not guarantee future results. The value of investments can go down as well as up.
Market data displayed on this site is provided by third-party sources including Twelve Data, Yahoo Finance, and CoinGecko. We do not guarantee the accuracy, completeness, or timeliness of third-party data.
This content is designed for UK residents and reflects UK tax rules, thresholds, and legislation. It may not apply to other jurisdictions.
Using this website does not create a professional-client relationship of any kind. MJBurrows is not responsible for any financial loss, damage, or decision made based on the content presented. By using this site, you accept these terms.
This disclaimer may be updated from time to time without prior notice. Last reviewed: 23 April 2026.
MJBurrows is an independent UK personal finance publication, written and edited by Matthew Burrows. There is no parent company, no investor group, and no advertising sales team — decisions about what to cover and how to frame it are made by Matthew alone. Our full Editorial Policy sets out how the site operates in detail.
Commercial model. As of April 2026, MJBurrows generates no revenue. The site carries no display advertising, no affiliate links, no sponsored content, no paid product placements, and no pay-for-coverage arrangements. If this changes in future, it will be disclosed openly on the Editorial Policy page.
Sources. Articles and tools reference primary sources — HM Revenue & Customs (HMRC), gov.uk, the Bank of England, the Office for National Statistics (ONS), the Financial Conduct Authority (FCA), Companies House, and UK government departmental publications (DWP, Treasury). Calculator data uses HMRC-published rates for the 2026/27 tax year. Market data (tickers, asset prices) is provided by Twelve Data, Yahoo Finance, and CoinGecko.
Verification. Every published article is fact-checked before going live. Numerical claims are traced to their primary source, quotes are checked against the original speaker or document, and calculator outputs are tested against HMRC worked examples. See our verification and accuracy policy for the full process.
Corrections. If you spot an error, please report it via the Corrections page. A three-tier severity system commits to specific response times:
- Tier 1 — Urgent (material reader harm, defamatory statements, regulatory or legal issues): acknowledged within 24 hours, page actioned within 24 hours, correction published within 48 hours of confirmation.
- Tier 2 — High (significant factual errors that misinform readers): acknowledged within 3 working days, correction published within 7 working days of confirmation.
- Tier 3 — Standard (minor factual errors, dated references, missing context): acknowledged within 7 working days, correction published at the next regular content review (within the quarter).
Significant corrections are logged on the public Corrections log.
Updates and review cadence. Calculators are reviewed at least quarterly, plus event-driven updates when HMRC publishes new rates (Budget, Autumn Statement, new tax year). Guides are reviewed at least twice a year, with major rewrites whenever underlying regulation changes. Tax-year-sensitive content is prioritised for review at the April tax-year transition.
Get in touch. For editorial enquiries — corrections, story tips, reader questions — the address is contact@mjburrows.com. The contact page is at mjburrows.com/contact. Every email is read personally by Matthew.