
The FTSE 100 just hit another all-time high, and it’s all thanks to some surprisingly good news from across the pond. Wednesday saw London’s premier index close up 0.5% at a record-breaking 9,080 points—marking yet another milestone in what’s shaping up to be the UK market’s comeback year.
Why the surge? It’s simple: Trump’s trade deal with Japan has everyone betting that more friendly agreements are coming down the pipeline. And when markets smell opportunity, they don’t mess about.
FTSE 100 Performance: The Juicy Numbers
Here’s what’s got investors buzzing: the FTSE 100 is now up over 10% this year and smashed through the 9,000-point barrier for the first time ever just last week. Not bad for an index that many had written off.
What’s driving this stellar performance? Two key factors are doing the heavy lifting:
Bargain hunting: UK stocks have been trading at historically low valuations, making them irresistible to value investors looking for underpriced gems.
Safe haven appeal: The index’s defensive constituents are actually benefiting from global uncertainty—turns out being boring can be profitable when the world gets messy.

US-Japan Trade Deal Sparks Global Rally
The catalyst for Wednesday’s gains was Trump’s announcement of a trade agreement with Japan that’s got markets worldwide doing a happy dance. Originally, Japan was staring down the barrel of 24% tariffs on all exports to America—a punishment for what Trump called one of the “most egregious trade imbalances” with the US.
But diplomacy won the day. The new deal slashes those tariffs to 14%, whilst Japan commits to investing a whopping $550 billion directly into the US economy. Trump’s calling it “the largest trade deal in history,” and markets seem to agree it’s a big deal.
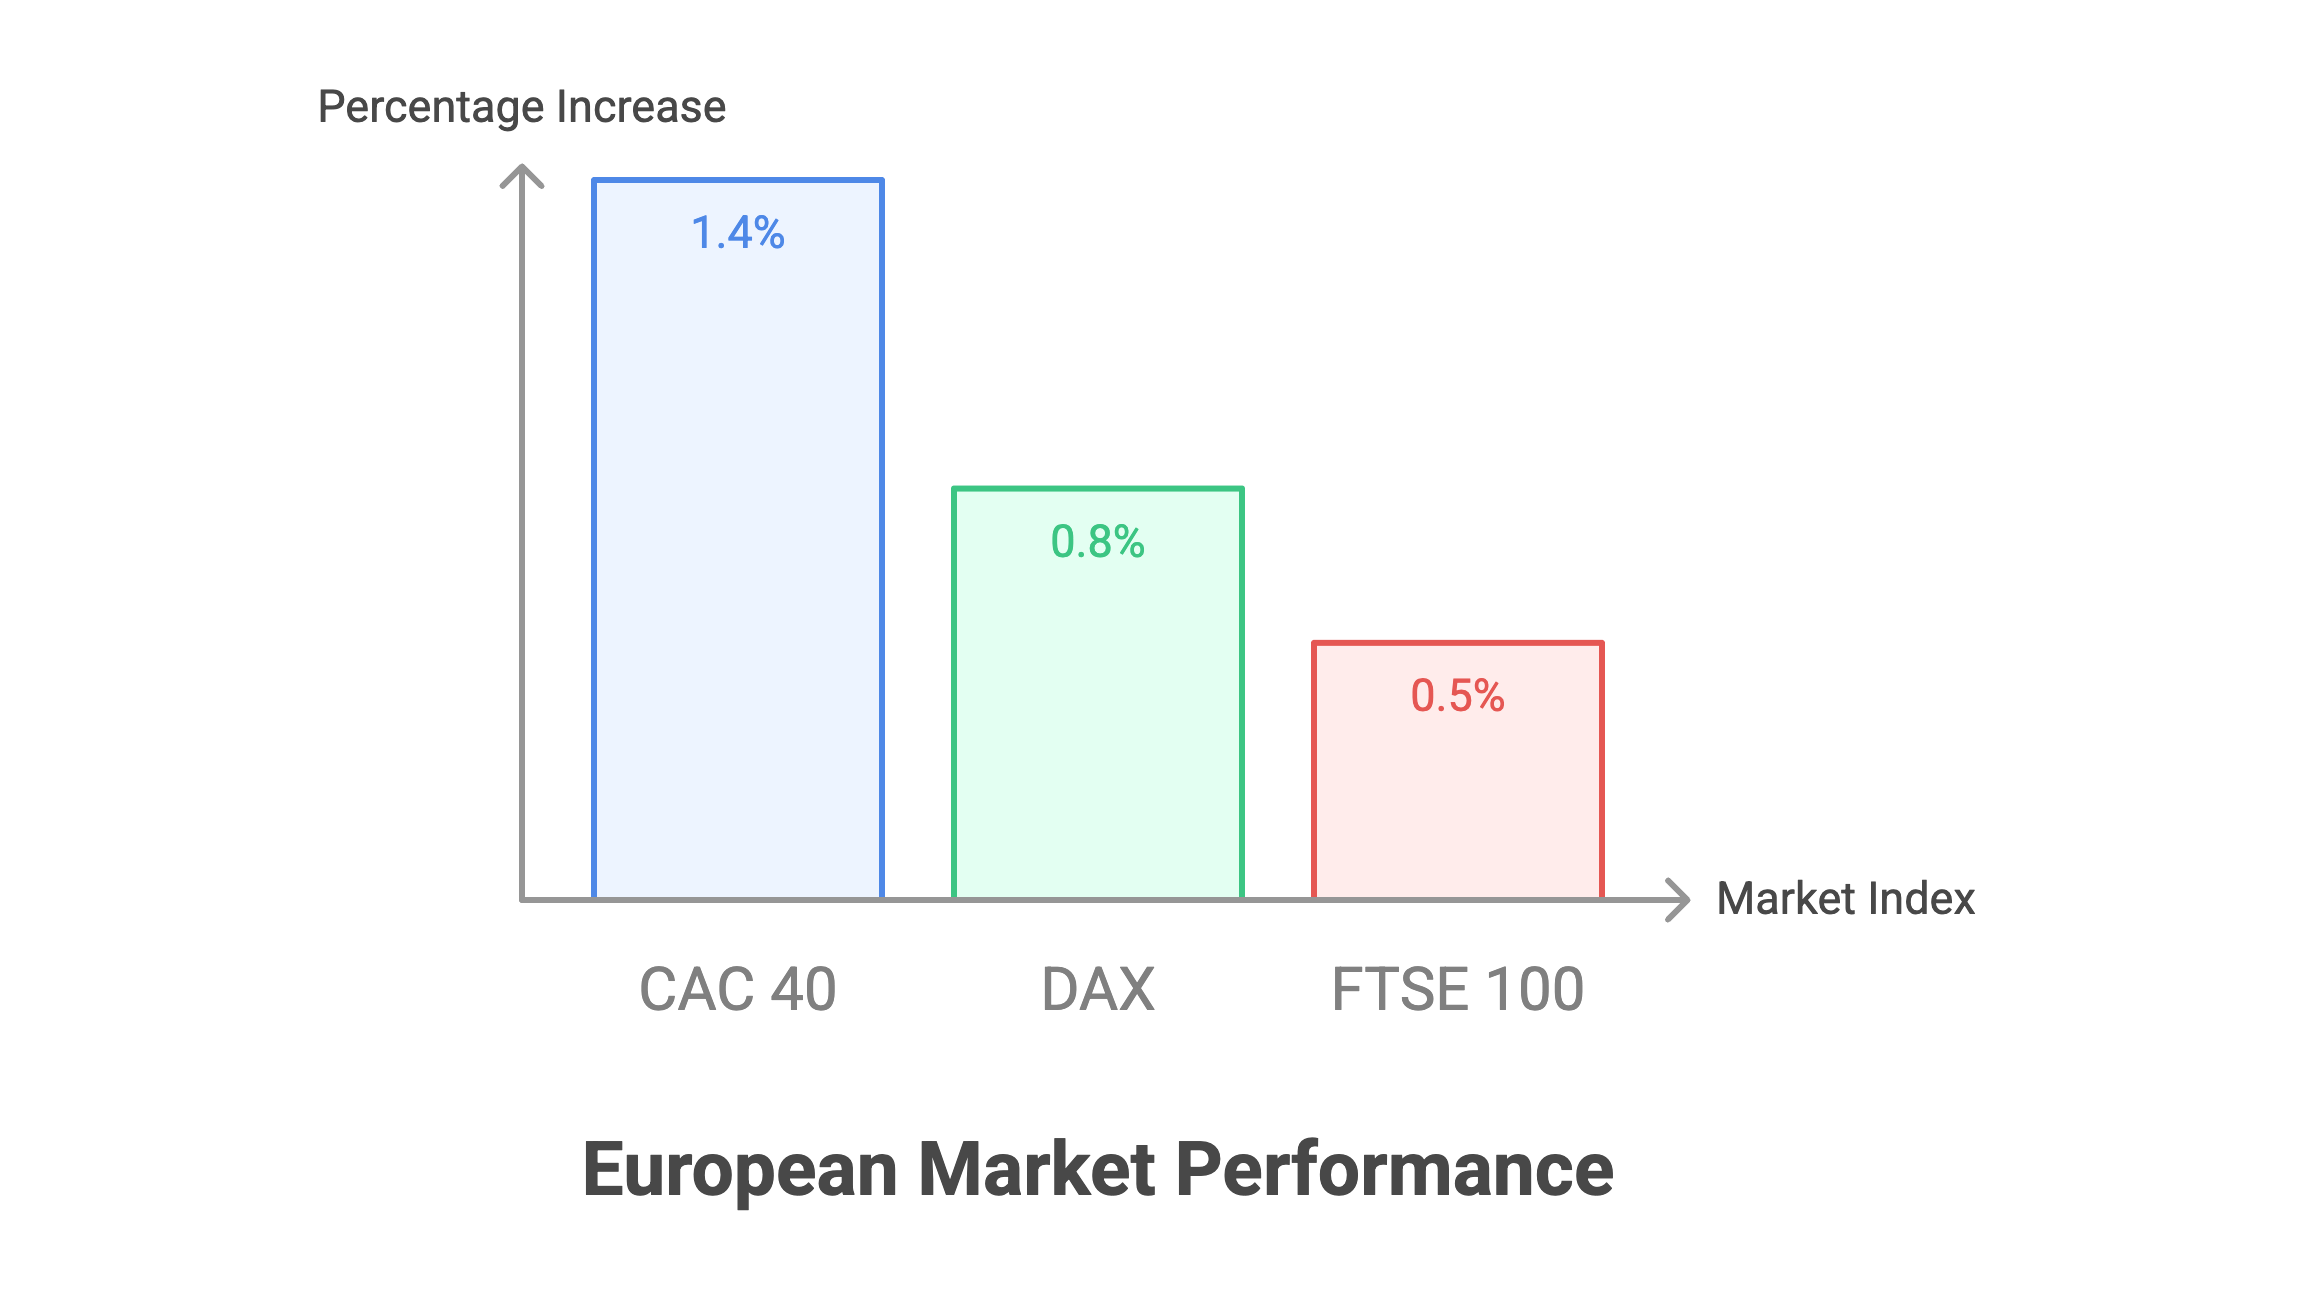
European Markets Join the Party
The good vibes didn’t stay in Asia. Japan’s Nikkei soared 3.5% on the news, with Toyota shares jumping an impressive 14%. European markets quickly caught the optimism bug:
- Paris’s CAC 40: +1.4%
- German DAX: +0.8%
- FTSE 100: +0.5% to record highs
“The longer term effect of tariffs remains to be seen, but for the moment, markets seem happy to cheer the home runs and ignore the misses,” said Laith Khalaf from AJ Bell.
What’s Next for Global Trade?
Reports suggest the EU is close to striking a similar deal that would bring their US export tariffs down to 15%. If that happens, we could see another wave of market euphoria.
But don’t pop the champagne just yet. Deutsche Bank’s Jim Reid warns that traders might be getting ahead of themselves. Several major economies—including Brazil and Canada—still face the threat of higher tariffs when Trump’s 1st August negotiation deadline hits.
Plus, there’s still talk of 50% sectoral tariffs on copper and other commodities. As Reid puts it: “This is far from the end just yet.”
The Bottom Line
The FTSE 100’s record-breaking run shows how quickly sentiment can shift in today’s markets. What started as fears over trade wars has morphed into optimism about deal-making. But smart investors know that in the world of international trade, today’s good news can become tomorrow’s headache.
For now, UK markets are riding high on the hope that Trump’s deal-making approach will create more winners than losers. Whether that optimism holds depends on what happens when the music stops on 1st August.
Want to stay ahead of market moves? Keep an eye on trade negotiations and remember—in volatile times like these, diversification isn’t just smart, it’s essential.
FAQ
Q1: Why is the FTSE 100 performing so well in 2025?
A: The index is benefiting from historically low valuations that are attracting value investors, plus its defensive stocks are actually thriving amid global uncertainty. It’s up over 10% this year and just hit 9,080 points for the first time ever.
Q2: What was the US-Japan trade deal about?
A: Japan avoided 24% tariffs by agreeing to 14% instead and committing to invest $550 billion in the US economy. Trump called it “the largest trade deal in history,” and markets loved the news.
Q3: Are other countries likely to get similar deals?
A: Possibly. Reports suggest the EU is close to a deal that would set their US export tariffs at 15%. However, countries like Brazil and Canada still face uncertainty as Trump’s 1st August deadline approaches.
Q4: Should investors be worried about future tariffs?
A: Deutsche Bank warns that several major economies still face tariff threats, and there’s talk of 50% sectoral tariffs on commodities like copper. The trade situation is far from resolved.
Q5: Is now a good time to invest in UK stocks?
A: The FTSE 100’s strong performance reflects improved sentiment, but remember that trade negotiations remain fluid. Any investment decision should consider your risk tolerance and be part of a diversified portfolio.
DISCLAIMER
Effective Date: 15th July 2025
The information provided on this website is for informational and educational purposes only and reflects the personal opinions of the author(s). It is not intended as financial, investment, tax, or legal advice.
We are not certified financial advisers. None of the content on this website constitutes a recommendation to buy, sell, or hold any financial product, asset, or service. You should not rely on any information provided here to make financial decisions.
We strongly recommend that you:
- Conduct your own research and due diligence
- Consult with a qualified financial adviser or professional before making any investment or financial decisions
While we strive to ensure that all information is accurate and up to date, we make no guarantees about the completeness, reliability, or suitability of any content on this site.
By using this website, you acknowledge and agree that we are not responsible for any financial loss, damage, or decisions made based on the content presented.
MORE NEWS


Disclosure & Editorial Standards
MJBurrows is not authorised or regulated by the Financial Conduct Authority (FCA). The content on this website — including articles, calculators, and tools — is for general informational and educational purposes only. It does not constitute personal financial, investment, tax, or legal advice and does not take into account your individual circumstances, financial situation, or objectives.
Nothing on this site is a personal recommendation to buy, sell, hold, or otherwise deal in any financial product, asset, or service. You should always conduct your own research and seek advice from a qualified, FCA-regulated financial adviser before making any financial decisions.
Our calculators produce estimates based on simplified models using HMRC-published rates for the current tax year. They cannot account for every individual circumstance and should not be relied upon as exact figures. Tax rules and rates may change — verify current rates with HMRC or a qualified tax adviser.
Projections are not guarantees. Where our tools show future values (investment growth, pension projections, compound interest), these are hypothetical illustrations based on assumed growth rates. Past performance does not guarantee future results. The value of investments can go down as well as up.
Market data displayed on this site is provided by third-party sources including Twelve Data, Yahoo Finance, and CoinGecko. We do not guarantee the accuracy, completeness, or timeliness of third-party data.
This content is designed for UK residents and reflects UK tax rules, thresholds, and legislation. It may not apply to other jurisdictions.
Using this website does not create a professional-client relationship of any kind. MJBurrows is not responsible for any financial loss, damage, or decision made based on the content presented. By using this site, you accept these terms.
This disclaimer may be updated from time to time without prior notice. Last reviewed: 23 April 2026.
MJBurrows is an independent UK personal finance publication, written and edited by Matthew Burrows. There is no parent company, no investor group, and no advertising sales team — decisions about what to cover and how to frame it are made by Matthew alone. Our full Editorial Policy sets out how the site operates in detail.
Commercial model. As of April 2026, MJBurrows generates no revenue. The site carries no display advertising, no affiliate links, no sponsored content, no paid product placements, and no pay-for-coverage arrangements. If this changes in future, it will be disclosed openly on the Editorial Policy page.
Sources. Articles and tools reference primary sources — HM Revenue & Customs (HMRC), gov.uk, the Bank of England, the Office for National Statistics (ONS), the Financial Conduct Authority (FCA), Companies House, and UK government departmental publications (DWP, Treasury). Calculator data uses HMRC-published rates for the 2026/27 tax year. Market data (tickers, asset prices) is provided by Twelve Data, Yahoo Finance, and CoinGecko.
Verification. Every published article is fact-checked before going live. Numerical claims are traced to their primary source, quotes are checked against the original speaker or document, and calculator outputs are tested against HMRC worked examples. See our verification and accuracy policy for the full process.
Corrections. If you spot an error, please report it via the Corrections page. A three-tier severity system commits to specific response times:
- Tier 1 — Urgent (material reader harm, defamatory statements, regulatory or legal issues): acknowledged within 24 hours, page actioned within 24 hours, correction published within 48 hours of confirmation.
- Tier 2 — High (significant factual errors that misinform readers): acknowledged within 3 working days, correction published within 7 working days of confirmation.
- Tier 3 — Standard (minor factual errors, dated references, missing context): acknowledged within 7 working days, correction published at the next regular content review (within the quarter).
Significant corrections are logged on the public Corrections log.
Updates and review cadence. Calculators are reviewed at least quarterly, plus event-driven updates when HMRC publishes new rates (Budget, Autumn Statement, new tax year). Guides are reviewed at least twice a year, with major rewrites whenever underlying regulation changes. Tax-year-sensitive content is prioritised for review at the April tax-year transition.
Get in touch. For editorial enquiries — corrections, story tips, reader questions — the address is contact@mjburrows.com. The contact page is at mjburrows.com/contact. Every email is read personally by Matthew.