
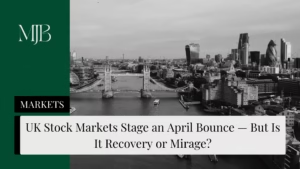
The FTSE 100 just wrapped its strongest quarter in nearly three years, climbing 6.7% despite geopolitical drama and Trump’s tariff chaos. London’s blue-chip index proved it can handle whatever the market throws at it, bouncing back from early-year lows to hit record highs.
So what’s driving this comeback? Let’s break down the quarterly performance, the key movers, and what it all means for investors heading into the next quarter.
Daily Performance: FTSE 100 Closes Higher Despite Morning Losses
London’s flagship index clawed back early losses to finish Tuesday up 0.54% at 9,350.43. It wasn’t a smooth ride – but when is it ever?
Pest control firm Reckitt and pharma heavyweight GSK led the charge, both closing up over 3%. Retailer JD Sports chipped in with a 2% gain, helping offset some heavyweight losses.
On the flip side? Tech giant BT dropped 2%, while oil majors Shell and BP both slid over 1.8% after OPEC+ announced plans to ramp up oil output. Crude prices nosedived 3% on the news, dragging energy stocks down with them.

Strong Quarterly Gains Despite Economic Headwinds
The FTSE 100’s 6.7% quarterly rise is its best since Q4 2022, when it posted an 8.1% gain. Not too shabby considering the UK economy hit the brakes in Q2, according to grim GDP data from the Office for National Statistics.
But here’s the thing: the market didn’t blink. Investors are clearly looking past short-term economic sluggishness and betting on bigger picture momentum.
Year-to-date, the FTSE 100 is up over 13% – an impressive recovery considering where we started.
Trump’s Tariff Chaos Couldn’t Keep the Index Down
Remember when Trump’s tariff offensive sent the FTSE 100 tumbling to 7,679.48 earlier this year? Yeah, those were dark days.
But as Trump walked back his trade war rhetoric, the index went on an absolute tear – notching a record 16 consecutive days of gains. That’s the kind of winning streak that makes traders giddy.
Of course, the White House had to remind everyone who’s boss. Trump’s appointment of a vaccine skeptic to lead the FDA’s Center for Biologics and Research sent pharma stocks into a tailspin, snapping the streak and pulling the index back into the red.
Classic Trump move: gives with one hand, takes away with the other.

Key Takeaways: What the FTSE 100’s Quarterly Rise Means
The FTSE 100 has proven resilient in the face of political chaos and economic uncertainty. With over 13% gains year-to-date and solid quarterly momentum, the index is showing strength. But stay alert – between unpredictable White House decisions and ongoing geopolitical tensions, volatility remains a constant companion.
Track the latest FTSE 100 movements and market analysis to stay ahead of the curve.
FAQ
Q1: What was the FTSE 100’s quarterly performance?
A: The FTSE 100 rose 6.7% this quarter, marking its strongest quarterly gain since Q4 2022. This performance helped push the index to record highs despite significant volatility throughout the period.
Q2: Why did oil stocks like Shell and BP fall?
A: Shell and BP dropped over 1.8% after OPEC+ announced plans to increase oil production. The news sent crude oil prices down 3%, putting pressure on energy sector stocks across the board.
Q3: How did Trump’s tariff policies affect the FTSE 100?
A: Trump’s tariff offensive initially sent the index down to 7,679.48. However, when he scaled back his trade war rhetoric, the FTSE 100 rebounded with a record 16-day winning streak before political uncertainty returned.
Q4: What caused the recent pharma stock selloff?
A: Trump appointed a vaccine sceptic to lead the FDA’s Center for Biologics and Research. The move spooked investors and sent pharma stocks like GSK tumbling, dragging the broader index into negative territory.
Q5: Is the FTSE 100 a good investment right now?
A: The index is up over 13% year-to-date with strong quarterly momentum. However, political volatility and economic uncertainty remain key risks. Investors should consider their risk tolerance and diversification strategy before making moves.
DISCLAIMER
Effective Date: 15th July 2025
The information provided on this website is for informational and educational purposes only and reflects the personal opinions of the author(s). It is not intended as financial, investment, tax, or legal advice.
We are not certified financial advisers. None of the content on this website constitutes a recommendation to buy, sell, or hold any financial product, asset, or service. You should not rely on any information provided here to make financial decisions.
We strongly recommend that you:
- Conduct your own research and due diligence
- Consult with a qualified financial adviser or professional before making any investment or financial decisions
While we strive to ensure that all information is accurate and up to date, we make no guarantees about the completeness, reliability, or suitability of any content on this site.
By using this website, you acknowledge and agree that we are not responsible for any financial loss, damage, or decisions made based on the content presented.
MORE NEWS


Disclosure & Editorial Standards
MJBurrows is not authorised or regulated by the Financial Conduct Authority (FCA). The content on this website — including articles, calculators, and tools — is for general informational and educational purposes only. It does not constitute personal financial, investment, tax, or legal advice and does not take into account your individual circumstances, financial situation, or objectives.
Nothing on this site is a personal recommendation to buy, sell, hold, or otherwise deal in any financial product, asset, or service. You should always conduct your own research and seek advice from a qualified, FCA-regulated financial adviser before making any financial decisions.
Our calculators produce estimates based on simplified models using HMRC-published rates for the current tax year. They cannot account for every individual circumstance and should not be relied upon as exact figures. Tax rules and rates may change — verify current rates with HMRC or a qualified tax adviser.
Projections are not guarantees. Where our tools show future values (investment growth, pension projections, compound interest), these are hypothetical illustrations based on assumed growth rates. Past performance does not guarantee future results. The value of investments can go down as well as up.
Market data displayed on this site is provided by third-party sources including Twelve Data, Yahoo Finance, and CoinGecko. We do not guarantee the accuracy, completeness, or timeliness of third-party data.
This content is designed for UK residents and reflects UK tax rules, thresholds, and legislation. It may not apply to other jurisdictions.
Using this website does not create a professional-client relationship of any kind. MJBurrows is not responsible for any financial loss, damage, or decision made based on the content presented. By using this site, you accept these terms.
This disclaimer may be updated from time to time without prior notice. Last reviewed: 23 April 2026.
MJBurrows is an independent UK personal finance publication, written and edited by Matthew Burrows. There is no parent company, no investor group, and no advertising sales team — decisions about what to cover and how to frame it are made by Matthew alone. Our full Editorial Policy sets out how the site operates in detail.
Commercial model. As of April 2026, MJBurrows generates no revenue. The site carries no display advertising, no affiliate links, no sponsored content, no paid product placements, and no pay-for-coverage arrangements. If this changes in future, it will be disclosed openly on the Editorial Policy page.
Sources. Articles and tools reference primary sources — HM Revenue & Customs (HMRC), gov.uk, the Bank of England, the Office for National Statistics (ONS), the Financial Conduct Authority (FCA), Companies House, and UK government departmental publications (DWP, Treasury). Calculator data uses HMRC-published rates for the 2026/27 tax year. Market data (tickers, asset prices) is provided by Twelve Data, Yahoo Finance, and CoinGecko.
Verification. Every published article is fact-checked before going live. Numerical claims are traced to their primary source, quotes are checked against the original speaker or document, and calculator outputs are tested against HMRC worked examples. See our verification and accuracy policy for the full process.
Corrections. If you spot an error, please report it via the Corrections page. A three-tier severity system commits to specific response times:
- Tier 1 — Urgent (material reader harm, defamatory statements, regulatory or legal issues): acknowledged within 24 hours, page actioned within 24 hours, correction published within 48 hours of confirmation.
- Tier 2 — High (significant factual errors that misinform readers): acknowledged within 3 working days, correction published within 7 working days of confirmation.
- Tier 3 — Standard (minor factual errors, dated references, missing context): acknowledged within 7 working days, correction published at the next regular content review (within the quarter).
Significant corrections are logged on the public Corrections log.
Updates and review cadence. Calculators are reviewed at least quarterly, plus event-driven updates when HMRC publishes new rates (Budget, Autumn Statement, new tax year). Guides are reviewed at least twice a year, with major rewrites whenever underlying regulation changes. Tax-year-sensitive content is prioritised for review at the April tax-year transition.
Get in touch. For editorial enquiries — corrections, story tips, reader questions — the address is contact@mjburrows.com. The contact page is at mjburrows.com/contact. Every email is read personally by Matthew.